


Table of contents
50 Revenue Cycle KPIs Every Orthopedic Group Must Track To Measure Success in 2026
What if the way you measure your revenue cycle is quietly holding your orthopedic group’s growth back?
In 2026, where healthcare margins just keep getting tighter, and the administrative complexity never seems to let up. If your financial picture isn’t crystal clear, you’re basically taking a shot in the dark.
Think about it. Payer denials are piling up, patients are paying more out of pocket, and prior authorizations feel like a moving target. It’s rough out there, maybe rougher than it’s ever been, for orthopedic practices trying to get paid.
Here’s a hard truth: admin costs eat up almost a third of healthcare spending. That’s way higher than most industries. So if your billing, claims, or collections aren’t running smoothly, even little mistakes can mess with your cash flow and make day-to-day operations a headache.
Meanwhile, your revenue cycle team? They’re under the microscope.
According to a survey of 116 industry CFOs conducted by HFMA, 88% of respondents expect to spend more time on strategy in the next three years. Other areas of increased focus include revenue cycle (63%) and cost management (62%).
Why Revenue Cycle KPIs Will Define Orthopedic Success in 2026?
As per Deloitte’s 2026 Global Healthcare Outlook, 70% of healthcare executives cited improving operational efficiency as their top priority due to persistent financial pressures, which directly impacts cash flow and revenue integrity.
That’s even more important to them than cutting costs or reworking their staffing.
So, tracking the right KPIs is non-negotiable. KPIs show you if your revenue cycle strategy actually works, or if it’s just covering up deeper problems. They cut through the noise and help your orthopedic practice or any healthcare providers make smarter calls, whether it’s with payers, preventing denials, collecting from patients, or just running things more efficiently.
Why Are Revenue Cycle KPIs Critical for Orthopedic Groups in 2026?
Like the dashboard of a complex surgical navigation system, revenue cycle KPIs help orthopedic leaders monitor performance without getting lost in transactional details.
These KPIs:
- Show where revenue is delayed, denied, or written off
- Identify payer-specific and procedure-specific risks
- Support staffing, outsourcing, and technology choices
- Allow proactive intervention before cash flow worsens
With more procedure bundling, stricter medical necessity audits, and higher out-of-pocket costs for patients, orthopedic practices that don’t monitor the right KPIs risk losing revenue silently.
Let us break down the Top 50 Revenue Cycle KPIs Every Orthopedic Group Must Track in 2026 – a framework built to help you grow, keep the cash flowing, and make sure your practice’s finances are ready for whatever comes next.
50 Orthopedic KPIs That Impact Revenue, Quality, and Outcomes
A. Cash Flow & A/R Performance
According to Black Book Research’s 2025 survey of 902 U.S. provider revenue cycle executives, over 42% of aging accounts receivable (A/R) is now tied to complex claims that require advanced capabilities far beyond standard billing office functions.
1. Days in Accounts Receivable (Days in A/R)
This KPI measures the average number of days it takes an orthopedic group to receive payment after services are provided. Orthopedic care often involves expensive procedures, implants, and coordination among multiple payers.
Longer Days in A/R can heavily impact cash flow and working capital. Fewer Days in A/R indicate quicker payments and a healthier revenue cycle.
Days in A/R = Total Accounts Receivable ÷ Average Daily Charges
Example:
An orthopedic surgery group has $4.5M in A/R and $75,000 in average daily charges.
Days in A/R = 4,500,000 ÷ 75,000 = 60 days
Why It Matters?
When you see Days in A/R creeping up, that’s a red flag. It usually means something got missed; maybe paperwork, maybe an authorization, or maybe the payer’s dragging their feet. Either way, it messes with your cash flow. Keeping Days in A/R low means you get paid faster, keep your finances healthier, and just run a tighter operation overall.
Practical Recommendations:
- Send in clean claims within 24-48 hours
- Keep an eye on how long each payer takes
- Follow up quickly on surgical claims
- Let automation handle as much of your A/R process as possible
2. Total Accounts Receivable Balance
This is the total amount patients and payers still owe at any given time. For orthopedic groups, if this balance keeps rising, it probably means claims are stuck somewhere – maybe because of payer delays, authorization issues, or patients owing more. Watching this number helps leaders spot revenue risks early.
Total A/R = Sum of all outstanding unpaid claim and patient balances
Why It Matters?
Total Accounts Receivable Balance is basically all the money: insurance and patient payments that your orthopedic practice is still waiting to collect. In orthopedics, big-ticket surgeries, pricey implants, and a mix of payers can turn even minor payment delays into a growing A/R pile fast. If your A/R balance keeps climbing, it’s usually the first clue that claims are stuck, payers are dragging their feet, authorizations are missing, or patients just aren’t paying.
Practical Recommendations:
- Break down your A/R by payer, age, and service line.
- Go after the high-dollar surgical claims first.
- Check on unresolved denials every week.
- Get serious about reaching out to patients and offer better ways for them to pay.
3. A/R Over 120 Days (%)
This tracks what percentage of receivables have been sitting around for more than 120 days – basically, the money that’s hardest to collect. In orthopedics, these old balances usually mean denials weren’t resolved, paperwork is missing, or all appeal options are used up. Keeping this number low protects long-term revenue.
A/R Over 120 Days (%) = (A/R >120 Days ÷ Total A/R) × 100
Why It Matters?
When a big chunk of your receivables sits around for more than 120 days, your revenue cycle is practically shouting for help. Claims don’t get better with age; after four months, they’re way harder to collect and probably headed for write-off territory.
If balances hang around this long, it’s usually because denials got ignored, follow-ups fizzled out, or patient payments just fell through the cracks. That money isn’t coming; it’s already slipping away.
Practical Recommendations:
- Set strict follow-up deadlines for old claims.
- Put your best people on tough orthopedic denials.
- Appeal early and keep a close eye on each payer’s deadlines.
- Figure out what’s causing claims to age out in the first place.
4. Net Collection Rate (NCR)
Net Collection Rate tells you how much collectible revenue actually makes it in, after adjusting for contracts. Since contracts drive most orthopedic payments, NCR is one of the best ways to see how well the revenue cycle is working and if payers are holding up their end.
Net Collection Rate = Payments ÷ (Charges – Contractual Adjustments) × 100
Example:
An orthopedic surgery group billed $2 million in total charges for procedures such as joint replacements and sports medicine cases over a quarter. Based on payer contracts, $800,000 was written off as contractual adjustments. From the remaining allowable amount, the practice successfully collected $1.14 million in payments.
Net Collection Rate = 1,140,000 ÷ (2,000,000 – 800,000) × 100 = 95%
Why It Matters?
Net Collection Rate tells you what percentage of your allowable orthopedic revenue actually makes it into your bank account, after all those contract adjustments. Since contracts drive so much of ortho reimbursement, NCR is one of the clearest signs of how well your revenue cycle is running. A strong NCR means you’re actually collecting what you’ve earned.
Practical Recommendations
- Regularly review your payer contracts and fee schedules.
- Find and appeal underpaid claims.
- Cut out unnecessary write-offs.
- Track your NCR by payer and by procedure.
5. Gross Collection Rate (GCR)
Gross Collection Rate is the percentage of total charges you actually collect before any adjustments. It’s not as exact as NCR, but it gives a good overall sense of how well billing is working. Big gaps here can point to denials or underpayments, which pop up a lot in orthopedic billing.
Gross Collection Rate = Total Payments ÷ Total Charges × 100
Why It Matters?
Gross Collection Rate looks at total payments as a percent of total charges before any adjustments. It’s less precise than NCR but still gives you a broad sense of how well your billing works. If your GCR is dropping, it probably means more denials, missing documentation, or front-end mistakes are messing up surgical claims.
Practical Recommendations
- Make sure claims are accurate the first time you submit them.
- Cut down on initial denials by tightening up documentation.
- Watch for payer-specific trends in collections.
- Compare GCR and NCR to get a fuller picture.
6. Average Revenue per Case
This one shows the average amount brought in for each orthopedic case or procedure. It’s especially important for surgeries like joint replacements, spine, or sports medicine, where contracts, implants, and coding accuracy all directly affect how much you get paid.
Average Revenue per Case = Total Payments ÷ Total Cases
Why It Matters?
Average Revenue per Case shows how well your practice turns each visit or surgery into actual revenue. Orthopedics covers everything from quick office visits to big surgeries, so this KPI pulls together the effects of coding accuracy, contract terms, implant reimbursement, and documentation quality.
Practical Recommendations
- Get CPT, modifier, and implant codes right every time.
- Review how much you’re getting paid by procedure and payer.
- Back up complex cases with strong clinical documentation.
- Look at trends by service line – spine, joints, sports medicine.
7. Revenue per FTE
Revenue per FTE measures how efficiently the staff is turning their work into cash. For orthopedic groups dealing with staffing headaches and rising labor costs, this helps decide if it’s time to automate, outsource, or just tweak workflows to do better.
Revenue per FTE = Total Revenue ÷ Total Revenue Cycle FTEs
Why It Matters?
Revenue per FTE tells you how efficiently your team is handling the revenue cycle as your practice grows. With labor costs rising and staff sometimes stretched thin, this metric helps you see if your billing operation can keep up—or if it’s close to the breaking point.
Practical Recommendations
- Automate things like eligibility checks, charge capture, and follow-ups.
- Spread the workload fairly between billing and coding staff.
- Cut down on rework caused by denials and mistakes.
- Lean on expert orthopedic RCM help when you need it.
8. Average Payment Time
This tracks how long payers take to pay claims after they’re submitted. Orthopedic claims, especially surgeries, can take longer because of documentation or authorization reviews. Keeping an eye on this helps spot which payers are dragging their feet.
Average Payment Time = Sum of (Payment Date – Submission Date) ÷ Paid Claims
Why It Matters?
Average Payment Time tracks how long payers take to pay you after you send in a claim. Since surgical claims often need extra review, ortho practices can get hit hard by slow payments that mess with cash flow.
Practical Recommendations
- Submit everything payers need the first time.
- Keep tabs on how quickly each payer pays.
- Chase down slow claims before they become a real problem.
- Spot which payers are always dragging their feet.
9. Credit Balance Over 30 Days
Credit balances come from overpayments or posting errors. If these aren’t managed, they can cause compliance headaches and frustrate patients. Tracking this helps make sure refunds happen on time and the books stay clean.
Credit Balance >30 Days = Total credit balances aged over 30 days
Why It Matters?
Credit balances pop up when you get overpaid or make posting mistakes and don’t fix them. In ortho, letting credit balances pile up can turn into compliance headaches, mess up your A/R numbers, and frustrate patients when refunds take forever.
Practical Recommendations
- Audit credit balances regularly.
- Clear up overpayments fast.
- Get more accurate with payment posting.
- Set and stick to refund timelines.
10. Bad Debt Rate
Bad Debt Rate measures how much revenue is lost because patient balances can’t be collected. With more orthopedic patients paying out of pocket, controlling bad debt is key to staying profitable.
Bad Debt Rate = Bad Debt Write-Offs ÷ Total Charges × 100
Example:
Over the course of a year, an orthopedic clinic generated $3 million in total charges across surgical and outpatient services. Despite collection efforts, $180,000 of patient balances were ultimately written off as bad debt, largely due to unpaid deductibles and coinsurance after insurance adjudication.
Bad Debt Rate = 180,000 ÷ 3,000,000 × 100 = 6%
Why It Matters?
Bad Debt Rate is the chunk of revenue you have to write off because patients didn’t pay. With patients picking up more of the bill for ortho procedures, a high bad debt rate hits your bottom line hard and points to problems collecting upfront or explaining costs to patients.
Practical Recommendations
- Collect estimated patient payments before you provide services.
- Offer payment plans that make sense for patients.
- Let patients know about costs early and clearly.
- Follow up on unpaid patient balances right away.
B. Claims Quality & Submission Efficiency
11. Clean Claim Rate
Clean Claim Rate shows the percentage of orthopedic claims that make it through payer edits and get accepted without any errors the first time. Orthopedic billing gets tricky – there’s a lot going on with different CPT codes, modifiers, and making sure diagnoses and procedures actually line up. Clean claims keep payments moving without delays. If your clean claim rate is low, there’s usually something wrong earlier in the process – maybe with coding, documentation, or checking patient eligibility.
Clean Claim Rate = (Clean Claims ÷ Total Claims Submitted) × 100
Example:
Over the course of a month, a multi-location orthopedic practice submitted 10,000 insurance claims for surgical, imaging, and outpatient services. On the first submission, 9,400 of those claims were accepted by payers without errors or rejections, while the remaining claims required corrections or resubmission due to coding or documentation issues.
Clean Claim Rate = 9,400 ÷ 10,000 × 100 = 94%
Why It Matters?
Clean Claim Rate shows how often payers accept your orthopedic claims the first time, without edits or rejections. Orthopedic billing gets tricky; think modifiers, authorizations, and all that documentation. When your clean claim rate’s high, payments come faster and you spend less time fixing mistakes.
Practical Recommendations
- Use claim scrubbing tools.
- Double-check authorizations and eligibility before billing.
- Make sure your codes and modifiers are spot-on.
- Watch for payer rejection patterns.
12. First-Pass Resolution Rate (FPRR)
First-Pass Resolution Rate tells you how many claims get paid in full the first time—no rework, no denials, no resubmissions. In orthopedics, a high FPRR means you’re nailing authorizations, your documentation is tight, and coding meets the mark. The higher this number, the less you spend chasing payments and the faster money comes in.
First-Pass Resolution Rate = (Claims Paid on First Submission ÷ Total Claims) × 100
Why It Matters?
First-Pass Resolution Rate tells you the percentage of orthopedic claims paid in full, with no follow-up, corrections, or appeals needed. A high rate here means your revenue cycle’s healthy and you’re not drowning in admin work, even with complex surgeries.
Practical Recommendations
- Submit claims that are complete and accurate right from the start.
- Attach all the clinical documentation payers ask for.
- Match your coding to each payer’s rules.
- Track what causes claims to fail so you can fix the real issues.
13. First-Pass Acceptance Rate
First-Pass Acceptance Rate tracks whether claims clear the first round with clearinghouses or payers – no hiccups. Orthopedic billing stumbles here when you miss a modifier, use the wrong diagnosis code, or mess up authorizations. Watching this number helps billing teams catch and fix issues early.
First-Pass Acceptance Rate = (Accepted Claims ÷ Submitted Claims) × 100
Why It Matters?
First-Pass Acceptance Rate tracks how many claims payers accept on the first try, even if payment comes later. In ortho practices, a low acceptance rate usually means you’ve got front-end errors; missing authorizations, wrong patient info, stuff like that.
Practical Recommendations
- Double-check patient demographics and insurance before you bill.
- Make sure you’ve got all the right authorizations.
- Check your claim formatting.
- Cut down on manual data entry mistakes.
14. Claim Denial Rate
Claim Denial Rate is the percent of your orthopedic claims that payers deny. Denials are a regular headache in orthopedics – think medical necessity questions, missed authorizations, or coding mistakes. Keeping tabs on denial rate helps you spot where money’s slipping away and hone in on ways to prevent it.
Claim Denial Rate = (Denied Claims ÷ Total Claims Submitted) × 100
Why It Matters?
Claim Denial Rate measures how many claims payers deny. Orthopedic practices run a higher risk because of medical necessity reviews, authorization rules, and complicated paperwork. Keeping this rate low helps protect your revenue.
Practical Recommendations
- Break down denial trends by payer and procedure.
- Tighten up your clinical documentation.
- Fix errors before you submit.
- Put denial prevention workflows in place.
15. Initial Denial Rate
Initial Denial Rate zeroes in on claims denied during the first review. In orthopedics, a high number here usually means something’s going wrong up front – maybe with patient eligibility verification, authorization, or pre-surgical paperwork. Cut down initial denials and you save time on appeals later.
Initial Denial Rate = (Initially Denied Claims ÷ Total Claims) × 100
Why It Matters?
Initial Denial Rate shows the percentage of claims payers deny right out of the gate. Orthopedic services often demand prior authorization, detailed op reports, and solid proof of medical necessity. If your initial denial rate is high, something’s breaking down up front and it’s slowing your cash flow.
Practical Recommendations
- Strengthen eligibility and authorization checks.
- Make sure medical necessity documentation is ready before you submit.
- Match coding to each payer’s ortho policies.
- Train staff on common first-level denial reasons.
16. Final Denial Rate
Final Denial Rate measures the claims that stay denied after all appeals are done. These are losses that stick, often because of missing authorizations or not enough documentation. Keeping this rate low is key if you want steady, predictable revenue in orthopedics.
Final Denial Rate = (Final Denied Claims ÷ Total Claims) × 100
Why It Matters?
Final Denial Rate is all about the claims that stay denied after you’ve tried everything; appeals, corrections, the works. For ortho groups, these are often big-ticket surgeries. This rate shows how much revenue you’re never getting back.
Practical Recommendations
- Focus appeals on your most valuable procedures.
- Track how appeals turn out by denial type.
- Upgrade documentation for surgical cases.
- Spot patterns in denials you could prevent in the first place.
17. Claim Resubmission Rate
Claim Resubmission Rate shows how often you have to fix and resend claims. In orthopedics, every resubmission means more work for the billing team and slower payments, especially when big-ticket surgeries are on the line. If this rate is high, it’s probably a sign of ongoing issues with your coding or paperwork.
Claim Resubmission Rate = (Resubmitted Claims ÷ Total Claims) × 100
Why It Matters?
Claim Resubmission Rate tells you how often claims need fixing and resubmitting. High rates mean more admin costs and longer waits for payment, especially with complex cases; think multiple modifiers, implants, bundled services.
Practical Recommendations
- Work on getting clean claims up front.
- Standardize how you capture orthopedic charges.
- Use automated edits and validation tools.
- Dig into why claims keep needing resubmission.
18. Charge Lag (Days)
Charge Lag tracks the gap between when you provide a service and when you actually enter the charges into the billing system. In orthopedics, delays usually happen when operative notes, implant logs, or surgeon documentation come in late. Shortening charge lag helps you bill faster and keeps cash flowing.
Charge Lag = Charge Entry Date – Date of Service
Why It Matters?
Charge Lag measures how long it takes to enter charges after the ortho service is done. Slow charge capture for surgeries, injections, or imaging holds up claim submission and risks missing payer deadlines.
Practical Recommendations
- Push for same-day charge entry.
- Connect your EHR and billing systems.
- Standardize post-op documentation.
- Track lag times by provider and location.
19. Days to Submit Claims
This metric shows how quickly you get claims out the door after seeing a patient. Orthopedic practices can’t afford to drag their feet here – tight deadlines and complicated surgeries make speed essential. If you’re slow, you risk more denials and longer days in accounts receivable.
Days to Submit Claims = Claim Submission Date – Date of Service
Why It Matters?
Days to Submit Claims is about how fast you send claims to payers after entering charges. If it takes too long, you get paid late and risk missing strict filing deadlines.
Practical Recommendations
- Automate claim generation and submission.
- Cut down on manual holds.
- Monitor which payers have the longest delays.
- Set internal targets for turnaround times.
20. Timely Filing Denial Rate
Timely Filing Denial Rate is the percent of claims denied because they missed the payer’s filing deadline. Orthopedic billing is especially vulnerable here since the process involves lots of moving parts – documentation, coding, and approvals all have to sync up. If this rate goes up, it means something’s breaking down between your clinical, coding, and billing teams.
Timely Filing Denial Rate = (Timely Filing Denials ÷ Total Claims) × 100
Why It Matters?
Timely Filing Denial Rate tracks the percentage of claims denied for missing payer deadlines. These denials almost always mean lost revenue, especially for expensive surgeries. They’re some of the easiest losses to avoid.
Practical Recommendations
- Move fast on charge entry and claim submission.
- Keep close tabs on each payer’s filing limits.
- Set your own internal deadlines ahead of payer cutoffs.
- Use alerts for claims getting close to the deadline.
C. Denials & Appeals Intelligence
The State of Claims Report reveals that denial rates of 10% or more are increasing among providers, with 68% attributing denials to inaccurate or incomplete intake data, while just 56% feel their existing claims technology supports today’s revenue cycle requirements.
21. Denial Appeal Rate
Denial Appeal Rate tells you how often a practice fights back against denied orthopedic claims. Orthopedic procedures aren’t cheap, so appealing denials can really pay off. This number basically shows how much a practice stands up for its revenue.
Denial Appeal Rate = (Appealed Denials ÷ Total Denials) × 100
Why It Matters?
If you don’t appeal enough, you’re basically leaving money on the table. Appeal too much, and you burn through resources for little return. This KPI helps practices find that sweet spot; recovering revenue without bogging down the team.
Practical Recommendations
- Set clear thresholds for which claims are worth appealing.
- Focus on denials tied to surgeries and implants; they usually matter most.
- Use automation to spot claims that make sense to appeal.
- Standardize how you handle appeals for each payer.
22. Appeal Success Rate
This one tracks how often those appealed denials actually get reversed and paid. A high success rate means the practice has solid documentation, gets coding right, and understands how to make each payer listen. All of this matters a lot when it comes to getting paid for orthopedic care.
Appeal Success Rate = (Successful Appeals ÷ Appeals Submitted) × 100
Why It Matters?
If Appeal Success Rate is low, it usually means your documentation isn’t strong enough, you’re missing medical necessity details, or your appeals don’t match what payers want.
Practical Recommendations:
- Make sure your operative and clinical documentation is solid.
- Tailor each appeal to fit the payer’s specific requirements.
- Track which types of denials you win or lose.
- Keep adjusting your appeal approach based on results.
23. Top 10 Denial Reasons
Here, you find out the main reasons claims get denied; things like missing authorizations, not enough medical necessity, or errors in coding. When orthopedic groups dig into these details, they can fix weak spots in their process and handle payers better.
Frequency-ranked analysis of denial codes
Why It Matters?
Tracking the Top 10 Denial Reasons helps you zero in on the handful of problems that drain most of your revenue. Usual suspects? Missing authorizations, coding mistakes, and arguments about medical necessity; especially for surgeries.
Practical Recommendations:
- Rank your denial reasons by both frequency and dollars lost.
- Make someone responsible for fixing each big category.
- Tackle the problems early; during scheduling and coding.
- Watch trends every month and make sure things are improving.
24. Coding-Related Denial Rate
This measures denials that happen because of coding mistakes – wrong CPT, ICD-10 codes, or modifiers. Orthopedic coding is a beast, so keeping track of this metric helps practices stay compliant and protect their bottom line.
Coding-Related Denial Rate = (Coding Denials ÷ Total Claims) × 100
Why It Matters?
This shows how often claims get denied because of coding errors. Orthopedic coding is tricky; wrong CPT codes, missing modifiers, or bad diagnosis links can stall payments fast.
Practical Recommendations:
- Use coders who know orthopedics inside and out.
- Audit your riskiest procedures on a regular basis.
- Keep your coding rules current with every payer.
- Run automated checks before sending claims out the door.
25. Prior Authorization-Related Denial Rate
This one highlights how many denials stem from authorization problems – a big threat to orthopedic revenue cycle management. If this rate is high, it means there’s trouble capturing, tracking, or meeting payer authorization rules.
Auth-Related Denial Rate = (Auth Denials ÷ Total Claims) × 100
Why It Matters?
This KPI tracks denials that happen because you missed, messed up, or just didn’t have a prior authorization. Since so many ortho procedures need pre-approval, these denials hurt; and most of them are totally avoidable.
Practical Recommendations:
- Double-check authorization needs when you schedule the patient.
- Make sure what’s authorized matches what you actually bill.
- Track which payers deny authorizations the most.
- Send in strong, clear documentation with every request.
26. Underpayment Detection Rate
This shows how often practices catch claims that pay out less than what’s in the contract. Underpayments are common in orthopedics, thanks to things like bundling rules or implant carve-outs.
Underpayment Detection Rate = (Underpaid Claims Identified ÷ Paid Claims) × 100
Why It Matters?
Underpayment Detection Rate tells you how good you are at catching claims that pay less than your contract says they should. With expensive surgeries and implants, even small shortfalls add up fast if you don’t spot them.
Practical Recommendations:
- Compare every payment with what your payer contracts promise.
- Use tools that flag possible underpayments automatically.
- Make sure high-cost procedures always get a second look.
- Break down underpayments by payer and by procedure so you see patterns.
27. Underpayment Recovery Rate
This tracks how much underpaid money gets clawed back. If a practice recovers a lot, it means they stay on top of contracts and don’t let payers off the hook.
Underpayment Recovery Rate = (Recovered Amount ÷ Underpaid Amount) × 100
Why It Matters?
This tracks how many underpayments you actually recover once you find them. Spotting underpayments is only half the game; if you don’t get the money back, you’re still losing out. Low recovery points to weak follow-up or trouble pushing payers to pay up.
Practical Recommendations:
- Go after the biggest-dollar underpayments first.
- Build specific recovery workflows for each payer.
- Put dedicated staff on underpayment appeals.
- Watch how long it takes to get paid after you flag a claim.


D. Prior Authorization and Eligibility Control
28. Insurance Verification Rate
This measures how often staff check a patient’s eligibility before providing orthopedic care. High rates mean fewer surprise denials and less chance of patients getting hit with unexpected bills.
Insurance Verification Rate = (Verified Appointments ÷ Total Appointments) × 100
Why It Matters?
Insurance Verification Rate measures how reliably you check patient eligibility and benefits before each visit. With ortho’s high-dollar procedures and big patient responsibilities, sloppy verification leads straight to denials and unpaid balances.
Practical Recommendations
- Check eligibility when you schedule; and again before the patient arrives.
- Make sure coverage includes the specific procedure you plan to do.
- Confirm key details like deductibles and co-insurance.
- Track which verification mistakes are causing denials.
29. Verification Timeliness
This tracks how early eligibility gets checked before the procedure. Doing this ahead of time helps with scheduling and gives patients a clear picture of their costs.
Verification Timeliness = Date Verified – Date of Service
Why It Matters?
Verification Timeliness looks at how early you finish insurance checks before the procedure date. Last-minute verification means you risk missing authorizations, billing for uncovered care, or sticking patients with surprise bills.
Practical Recommendations
- Set deadlines for verification based on appointment type.
- Put surgical and implant-heavy cases at the top of the list.
- Automate reminders and build verification into your workflow.
- Track how timely each location and staff member is with verification.
30. Days Before Date of Service (DOS) Verified
This metric counts how many days before a scheduled procedure the practice checks insurance eligibility. Since orthopedic cases like surgeries or imaging often get booked weeks out, early verification gives everyone enough time to spot coverage gaps, referral needs, or missing authorizations. Wait too long, and you risk last-minute cancellations, denials, and unhappy patients. The best orthopedic groups usually verify eligibility 7 to 14 days before surgery.
Days Before DOS Verified = Date of Service – Verification Date
Why It Matters?
This KPI tracks how far ahead of the appointment insurance gets verified. If you wait until the last minute, you’re stuck scrambling, there’s barely any time to sort out coverage problems, get the green light for procedures, or even talk to patients about their costs.
Practical Recommendations
- Set clear minimums for how early you verify before surgeries.
- Adjust your timelines based on which insurance and procedure you’re dealing with.
- Keep tabs on your average days verified, broken down by appointment type.
- Flag and follow up on cases that aren’t verified within your set window.
31. Prior Authorization Approval Rate
This KPI shows how many prior authorization requests payers actually approve. Orthopedic procedures need a lot of authorizations because of medical necessity checks, site-of-service rules, and imaging requirements. When approval rates are low, it’s often because of poor documentation, the wrong CPT codes, or payer-specific mistakes. Boosting this rate keeps surgical revenue steady and makes better use of the operating room.
Prior Authorization Approval Rate = (Approved Authorizations ÷ Total Authorization Requests) × 100
Example:
An orthopedic group submitted 800 prior authorization requests over a quarter for services such as spine surgeries, advanced imaging, and injection therapies. Of those requests, 720 were approved by payers before the date of service, while the remaining requests were delayed or denied due to missing clinical documentation or payer-specific requirements.
Prior Authorization Approval Rate = 720 ÷ 800 × 100 = 90%
Why It Matters?
Prior Authorization Approval Rate shows how often you get the go-ahead on your first try. For orthopedic practices, every denial means a surgery gets pushed back, schedules get messed up, and the money takes longer to come in.
Practical Recommendations
- Make sure you send in all the right clinical info from the start.
- Double-check that your CPT codes actually match what the payer wants.
- Keep a close eye on approval rates, sorted by provider and by payer.
- Dig into denied requests, figure out what went wrong, and adjust your process.
32. Authorization Turnaround Time (TAT)
Authorization Turnaround Time tracks how long it takes for payers to make a decision on authorization requests. In orthopedics, slow turnaround times can push back surgeries, mess up schedules, and hurt patient outcomes. Looking at this KPI by payer helps practices spot delays, put urgent cases first, and tackle ongoing issues. When payers move faster, practices can schedule more reliably and give patients better access to care.
Authorization Turnaround Time = Authorization Decision Date – Authorization Submission Date
Why It Matters?
Authorization Turnaround Time measures how long it takes to receive payer approval after a prior authorization request is submitted. In orthopedic practices, slow authorization decisions can delay surgeries, imaging, and injections—leading to schedule disruptions, patient dissatisfaction, and lost revenue opportunities.
Practical Recommendations
- Submit complete clinical documentation on first request
- Track authorization status daily
- Prioritize high-value surgical cases
- Escalate delayed requests based on payer-specific timelines
33. Prior Authorization Denial Rate
This KPI shows how many authorizations get denied before the service even happens. In orthopedics, most denials come from missing documentation, not enough imaging, or wrong procedure requests. High denial rates pile on extra work for staff and can trigger last-minute appeals or rescheduling headaches. Watching this metric helps RCM teams tighten up their paperwork and fine-tune their approach for each payer.
Prior Authorization Denial Rate = (Denied Authorizations ÷ Total Authorization Requests) × 100
Why It Matters?
Prior Authorization Denial Rate tracks the percentage of authorization requests that are denied by payers. For orthopedic groups, high denial rates often indicate gaps in medical necessity documentation or misalignment with payer policies for procedures like joint replacements and spine surgeries.
Practical Recommendations
- Align authorization requests with payer clinical criteria
- Use standardized templates for orthopedic procedures
- Track denial reasons by payer
- Educate clinical staff on documentation requirements
34. Missing Authorization Denials
This one counts the claims denied simply because the practice didn’t have authorization on file at the time of service. These misses are expensive for orthopedic groups – lost revenue that’s almost always gone for good. Usually, these denials show up when there’s a breakdown in workflow between scheduling, clinical, and billing teams. Cutting down on missing authorizations is a quick way to protect revenue.
Missing Authorization Denials = Total Denials Citing No Authorization
Why It Matters?
Missing Authorization Denials occur when services are rendered without required payer approval. In orthopedics, these denials often affect high-cost surgical claims and are frequently non-recoverable, making them a major source of avoidable revenue loss.
Practical Recommendations
- Lock scheduling until authorization is confirmed
- Cross-check authorization details against final CPT codes
- Maintain payer-specific authorization checklists
- Audit surgical cases for authorization compliance
35. Authorization Requests by Payer
This KPI tracks how many authorization requests each payer requires. Orthopedic groups see huge differences here – some commercial payers want approvals for almost every surgery or imaging service. Knowing each payer’s requirements helps practices manage staffing, decide when to invest in automation, and gives leverage during negotiations.
Authorization Requests grouped and counted by Payer
Why It Matters?
This KPI tracks the volume and complexity of authorization requests across payers. Orthopedic practices often experience wide variation in authorization requirements, and understanding payer-specific demand helps allocate staff resources and streamline workflows.
Practical Recommendations
- Monitor authorization volume by payer and procedure
- Identify payers with high denial or delay rates
- Adjust staffing based on payer complexity
- Use payer insights to improve scheduling accuracy
E. Patient Financial Performance
36. Patient Co-Pay Collection Rate
This metric measures how well the practice collects patient copays compared to what’s expected. Copays for specialist visits are usually higher than for primary care, so missing them at check-in just means more billing work later. Getting this right up front clears up confusion for patients and improves their experience.
Patient Co-Pay Collection Rate = (Collected Copays ÷ Expected Copays) × 100
Why It Matters?
Patient Co-Pay Collection Rate measures how consistently co-payments are collected at or before the time of service. With rising patient financial responsibility in orthopedics, failure to collect co-pays upfront increases bad debt and administrative follow-up.
Practical Recommendations
- Communicate co-pay amounts before DOS
- Train front-desk staff on financial conversations
- Offer multiple payment options
- Monitor co-pay collection performance by location
37. Point-of-Service (POS) Collection Rate
POS Collection Rate looks at the percentage of a patient’s financial responsibility collected right when they come in, whether it’s for an office visit, injection, cast, or pre-op consult. Higher POS collections keep accounts receivable from piling up and cut down on bad debt.
POS Collection Rate = (POS Patient Payments ÷ Total Patient Responsibility) × 100
Why It Matters?
POS Collection Rate measures how much of the patient’s responsibility you’re collecting at check-in or check-out. Since orthopedic visits often lead to big bills, collecting at the visit cuts down on future billing headaches and bad debt.
Practical Recommendations
- Check patient responsibility before they arrive.
- Give staff up-to-date cost estimates.
- Offer several ways to pay at the front desk.
- Track POS collections by location.
38. Upfront Collections Rate
This KPI tracks payments collected before big-ticket procedures like joint replacements or arthroscopies. With deductibles climbing, upfront collections are crucial for steady cash flow. Practices that offer solid financial counseling usually do best here.
Upfront Collections Rate = (Upfront Payments ÷ Total Patient Responsibility) × 100
Why It Matters?
Upfront Collections Rate is all about payments you collect before providing orthopedic services. For elective surgeries or imaging, collecting ahead of time keeps cash flow steady and shrinks the risk of unpaid bills later.
Practical Recommendations
- Share clear cost estimates before the service.
- Take deposits for high-cost procedures.
- Discuss payment expectations during scheduling.
- Make sure financial counseling lines up with surgical planning.
39. Patient Out-of-Pocket (OOP) Collections
This metric covers all the payments patients make after insurance – deductibles, coinsurance, or anything insurance doesn’t cover. Orthopedic practices rely on OOP collections to cover high-cost procedures and keep up with rising patient responsibility. Keeping a close eye on this KPI helps practices offer care without risking their financial health.
Patient OOP Collections = Total Patient Payments Collected
Why It Matters?
This KPI measures how well you collect deductibles, coinsurance, and co-pays from patients. As more of the bill falls on patients, strong out-of-pocket collections keep your revenue on track.
Practical Recommendations
- Explain coverage and patient responsibility early.
- Send automated payment reminders.
- Offer flexible ways to pay.
- Watch OOP collections by payer and by procedure.
40. Payment Plan Default Rate
This KPI measures how often patients fall behind or stop paying on their payment plans. Orthopedic bills can get big, so payment plans are common – but they come with risk. High default rates mean more bad debt and extra work for follow-up. Sharper payment plan terms and automation help bring this number down.
Payment Plan Default Rate = (Defaulted Payment Plans ÷ Total Payment Plans) × 100
Why It Matters?
Payment Plan Default Rate tracks how often patients miss or drop out of payment plans. In orthopedics, weak payment plans lead to more bad debt and slower cash flow.
Practical Recommendations
- Offer payment plans patients can actually manage.
- Set up automatic payments.
- Check in regularly on payment plan performance.
- Step in quickly when someone misses a payment.
F. Coding Accuracy and Compliance
41. Coding Accuracy Rate
This KPI looks at how often coders get it right when auditing orthopedic cases. Orthopedic coding isn’t simple – there are lots of procedures, laterality, modifiers, and global periods to keep track of. Getting codes right matters, because mistakes lead to denials or audits from payers. High accuracy means coders know what they’re doing and doctors are documenting everything clearly.
Coding Accuracy Rate = (Correctly Coded Encounters ÷ Audited Encounters) × 100
Why It Matters?
Getting coding right the first time isn’t just a nice-to-have in orthopedics—it’s essential. There’s a lot going on: complex procedures, tricky modifiers, and insurance companies watching every detail. If your accuracy rate slips, you’re asking for headaches and delays.
Practical Recommendations
- Hire coders who know orthopedics inside out.
- Run regular audits on your coding.
- Keep your team in the loop about changes in payer rules.
- Bring in automated tools to catch mistakes before they go out.
42. CPT Code Accuracy Rate
This one zeroes in on whether the correct CPT codes are used for procedures. In orthopedics, using the wrong code doesn’t just mess up billing – it can mean lost revenue or trigger audits. Keeping an eye on this makes sure surgeries, injections, and imaging get billed the right way.
CPT Code Accuracy Rate = (Correct CPT Codes ÷ Audited CPT Codes) × 100
Why It Matters?
CPT code accuracy shows if you’re using the right procedure codes on claims. If you pick the wrong code, especially for surgeries or bundled services, you’re looking at denials, short payments, or compliance trouble.
Practical Recommendations
- Double-check CPT codes against the operative notes.
- Keep detailed, ortho-specific coding guidelines.
- Focus audits on procedures that tend to trip you up.
- Make CPT education an ongoing thing for your coders.
43. Modifier Accuracy Rate
Here, you’re looking at how well coders use modifiers like -59, -RT/-LT, -51, and -22. Modifiers might seem minor, but mistakes often cause claims to get denied, especially in cases with multiple or bilateral procedures. This KPI really matters for both getting paid correctly and staying compliant.
Modifier Accuracy Rate = (Correct Modifiers ÷ Audited Modifiers) × 100
Why It Matters?
Modifier accuracy isn’t just about getting paid; it’s about getting paid on time. Orthopedic claims often need multiple modifiers to spell out laterality, separate procedures, or unique services. Miss one, or mess up, and you’ll get denied or paid less.
Practical Recommendations
- Train coders on the ins and outs of orthopedic modifiers.
- Audit modifier use, especially for surgeries and bundles.
- Keep clear, payer-specific rules on hand.
- Set up edits to flag modifier conflicts before claims go out.
44. Medical Necessity Documentation Rate
This measures how often orthopedic documentation actually checks all the payer boxes for medical necessity. When doctors don’t document enough, denials and audits pile up. High rates here show that physicians are on top of documentation and following good workflows.
Medical Necessity Documentation Rate = (Compliant Records ÷ Audited Records) × 100
Why It Matters?
This KPI tells you if your claims have enough documentation to prove medical necessity. Missing or thin documentation is a top reason for denials, especially for surgeries, injections, and imaging.
Practical Recommendations
- Make sure your clinical notes line up with payer policies.
- Teach providers exactly what medical necessity means for their cases.
- Use checklists so nothing gets missed in documentation.
- Audit records before you submit claims.
45. Coding Denial Rate
This KPI tracks how many claims get denied because of coding mistakes. In orthopedics, common reasons are bundling errors, wrong modifiers, or diagnosis mismatches. Lowering this rate makes claims cleaner and cuts down on time spent fixing mistakes.
Coding Denial Rate = (Coding-Related Denials ÷ Total Claims) × 100
Why It Matters?
Coding Denial Rate tracks how many claims get rejected for coding mistakes. If this number’s high, you’re wasting time fixing claims, slowing down payments, and missing signs your coding process needs help.
Practical Recommendations
- Look for patterns in what gets denied.
- Give coders extra training where needed.
- Audit complex cases before billing.
- Use denial data to spot and fix weaknesses.
G. Payer Performance and Contract Compliance
46. Payer Mix by Revenue
This KPI breaks down where your revenue comes from by payer—Medicare, Medicaid, commercial plans, and so on. Orthopedic practices have to keep a close eye on this since different payers reimburse at different rates. Shifts in payer mix can change your bottom line fast and drive business decisions.
Payer Mix by Revenue = (Revenue by Payer ÷ Total Revenue) × 100
Why It Matters?
Knowing your payer mix by revenue is huge in orthopedics. Each payer: Medicare, Medicaid, & commercial pays differently. If you don’t watch the mix, you might get blindsided by shifts that hurt your bottom line.
Practical Recommendations
- Break down revenue by both payer and procedure.
- Keep an eye on changes in your payer mix.
- Let the data steer your contracts and services.
- Adjust your financial planning as reimbursement trends shift.
47. Payer-Specific Denial Rate
This tells you how often each individual payer denies claims. Orthopedic groups usually see big differences here, mostly because each payer has its own rules for authorizations and medical necessity. Spotting payers with high denial rates lets you fix processes or escalate problems quickly.
Payer-Specific Denial Rate = (Denials from Payer ÷ Claims Submitted to Payer) × 100
Why It Matters?
Tracking denial rates by payer shows you where the friction really is. Orthopedic claims get denied for all sorts of reasons, and policies vary a lot between payers. This KPI points out which payers slow you down the most.
Practical Recommendations
- Dig into denial trends by both payer and procedure.
- Spot gaps in payer-specific policies.
- Tweak your workflows for those high-denial payers.
- Bring your denial data to the table during negotiations.
48. Payment Timeliness by Payer
This one tracks how fast payers pay your claims. If a payer drags its feet, accounts receivable days climb and cash flow takes a hit. Watching this KPI helps hold payers accountable and makes cash flow easier to predict.
Payment Timeliness by Payer = Average Days from Submission to Payment per Payer
Why It Matters?
This KPI tells you how fast each payer actually pays up. Slow payments squeeze your cash flow, which hits hardest with expensive surgeries and implant costs on the line.
Practical Recommendations
- Track how long each payer takes to pay.
- Push back on late payments; stick to your contracts.
- Automate follow-ups so nothing slips through.
- Use payment speed data to decide where to focus your outreach.
49. Contractual Adjustment Rate
This measures how much you’re writing off based on what’s in your payer contracts. If this number suddenly jumps, it could mean the fee schedules are off, payers aren’t paying what they should, or something’s wrong with your contracts. Keeping tabs on this protects your revenue and helps you catch problems early.
Contractual Adjustment Rate = (Contractual Adjustments ÷ Gross Charges) × 100
Why It Matters?
Contractual Adjustment Rate shows how much of your charges get written off because of payer contracts. In orthopedics, these adjustments can make or break your margins, so you need to know if they’re in line with what you agreed to.
Practical Recommendations
- Keep your payer contract terms updated in your systems.
- Check adjustments against your negotiated rates.
- Watch for shifts in adjustment trends.
- Revisit contracts if certain procedures aren’t pulling their weight.
50. Payer Contract Compliance Rate
This tracks whether payers are actually sticking to the rates and terms in your contracts. Orthopedic care gets expensive – implants, surgeries, you name it—so even small deviations can cost you. Good results here mean you’re monitoring payers closely and have solid systems to recover underpayments.
Payer Contract Compliance Rate = (Claims Paid per Contract ÷ Total Paid Claims) × 100
Why It Matters?
Payer Contract Compliance Rate tracks if payers actually stick to the deals you’ve made. In orthopedics, non-compliance happens a lot—especially with complicated surgeries and implant-heavy cases. If you don’t catch it, you lose money.
Practical Recommendations
- Audit contract compliance regularly.
- Use tools that spot underpayments automatically.
- Appeal payments that don’t follow contract terms right away.
- Track which payers and services have the most problems.
From Metrics To Momentum: Transform Data Into Orthopedic Revenue Growth
Orthopedic practices that dig deeper than basic reports see what’s really going on with their revenue. They make decisions faster, and with a lot more confidence.
When orthopedic groups take a modern, data-driven approach to revenue cycle management, they see real changes. They cut down days in accounts receivable, boost their clean claim and first-pass acceptance rates, and keep denials and underpayments in check.
Plus, they can collect from patients more effectively – without making the experience worse.
If you track KPIs the same way across coding, billing, A/R follow-up, prior authorizations, and payer management, every number means something. You don’t just look at data; you act on it.
With the right revenue cycle strategies, practices get clear visibility into every part of their revenue cycle. They head off denials before they happen, manage appeals smarter, and make eligibility checks and authorizations less of a headache.
It’s easier to spot underpayments and recover what’s owed. And outcome-focused dashboards actually show progress, not just activity.
To have a great revenue cycle, you need clear info, open reports, and consistent work to improve. Orthopedic practices hit this when they focus on the key numbers that affect cash flow, follow the rules, and help the practice grow long-term. This way, they keep their money matters in order while still giving every patient top-notch care.
Frequently Asked Questions
A Revenue Cycle KPI is a financial metric directly tied to reimbursement results, including cash flow, collections, denial management, or compliance. This data comes from billing, EHR, clearinghouse, and payer information.
Unlike general business KPIs, revenue cycle KPIs focus on:
- How efficiently services turn into paid claims
- How quickly revenue is recognized
- How much revenue is lost to denials, underpayments, or patient bad debt
Many KPIs are ratios that highlight important relationships in revenue cycle data, such as payments collected relative to charges billed, claims paid on the first submission, or denials overturned through appeals.
A single KPI provides a snapshot of revenue cycle health at a specific point in time. KPIs become significantly more valuable when tracked over time, compared against specialty benchmarks, or evaluated together to uncover systemic issues such as front-end leakage, payer delays, or revenue loss caused by coding errors.
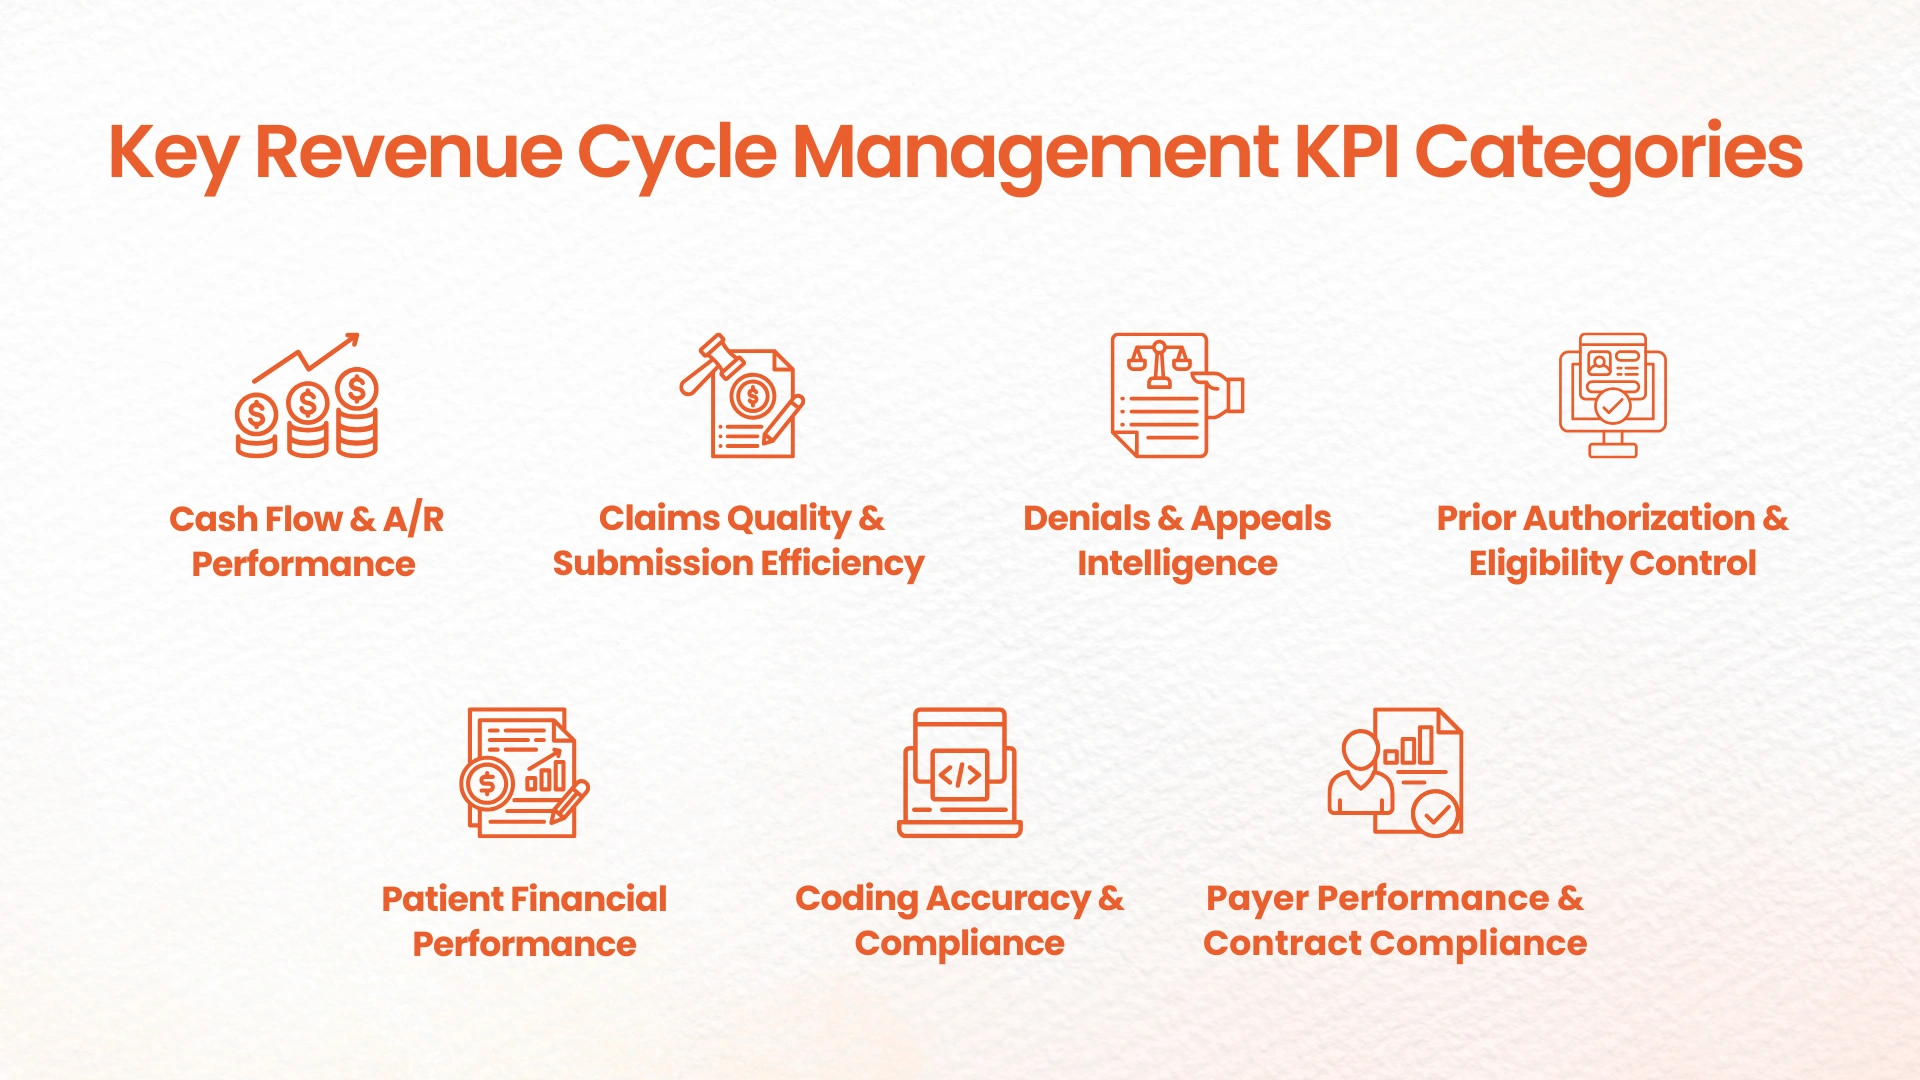
Most orthopedic revenue cycle management KPIs fall into seven major categories based on the section of the revenue cycle they measure:
- Cash Flow & A/R Performance
- Claims Quality & Submission Efficiency
- Denials & Appeals Intelligence
- Prior Authorization & Eligibility Control
- Patient Financial Performance
- Coding Accuracy & Compliance
- Payer Performance & Contract Compliance
Together, these categories give a complete view of orthopedic revenue cycle performance.


3 Comments
-
The sale of the timber to the neighboring farms shows Napoleon’s ineptitude at diplomacy. He is cheated, proving he is not as smart as he thinks. This plot twist is satisfying and revealing. Find it in the Animal Farm PDF. It shows that dictators are often incompetent as well as cruel. https://animalfarmpdf.store/ Fables Animal Farm Pdf
-
Our Lights Out PDF is perfect for archival purposes. The high-quality format ensures it will be readable for years to come. preserve your documents with our reliable files. https://lightsoutpdf.top/ Are The Northern Lights Out Tonight
-
Kris
Thanks for sharing this list, it’s a great reality check for any ortho practice. One thing that really helped us was working with national seating mobility</ to get our documentation cleaner for complex cases. It made a noticeable difference in our first-pass resolution rate. Really appreciate you putting this together.


