
Stop Treating Symptoms and Find the Actual Root Cause
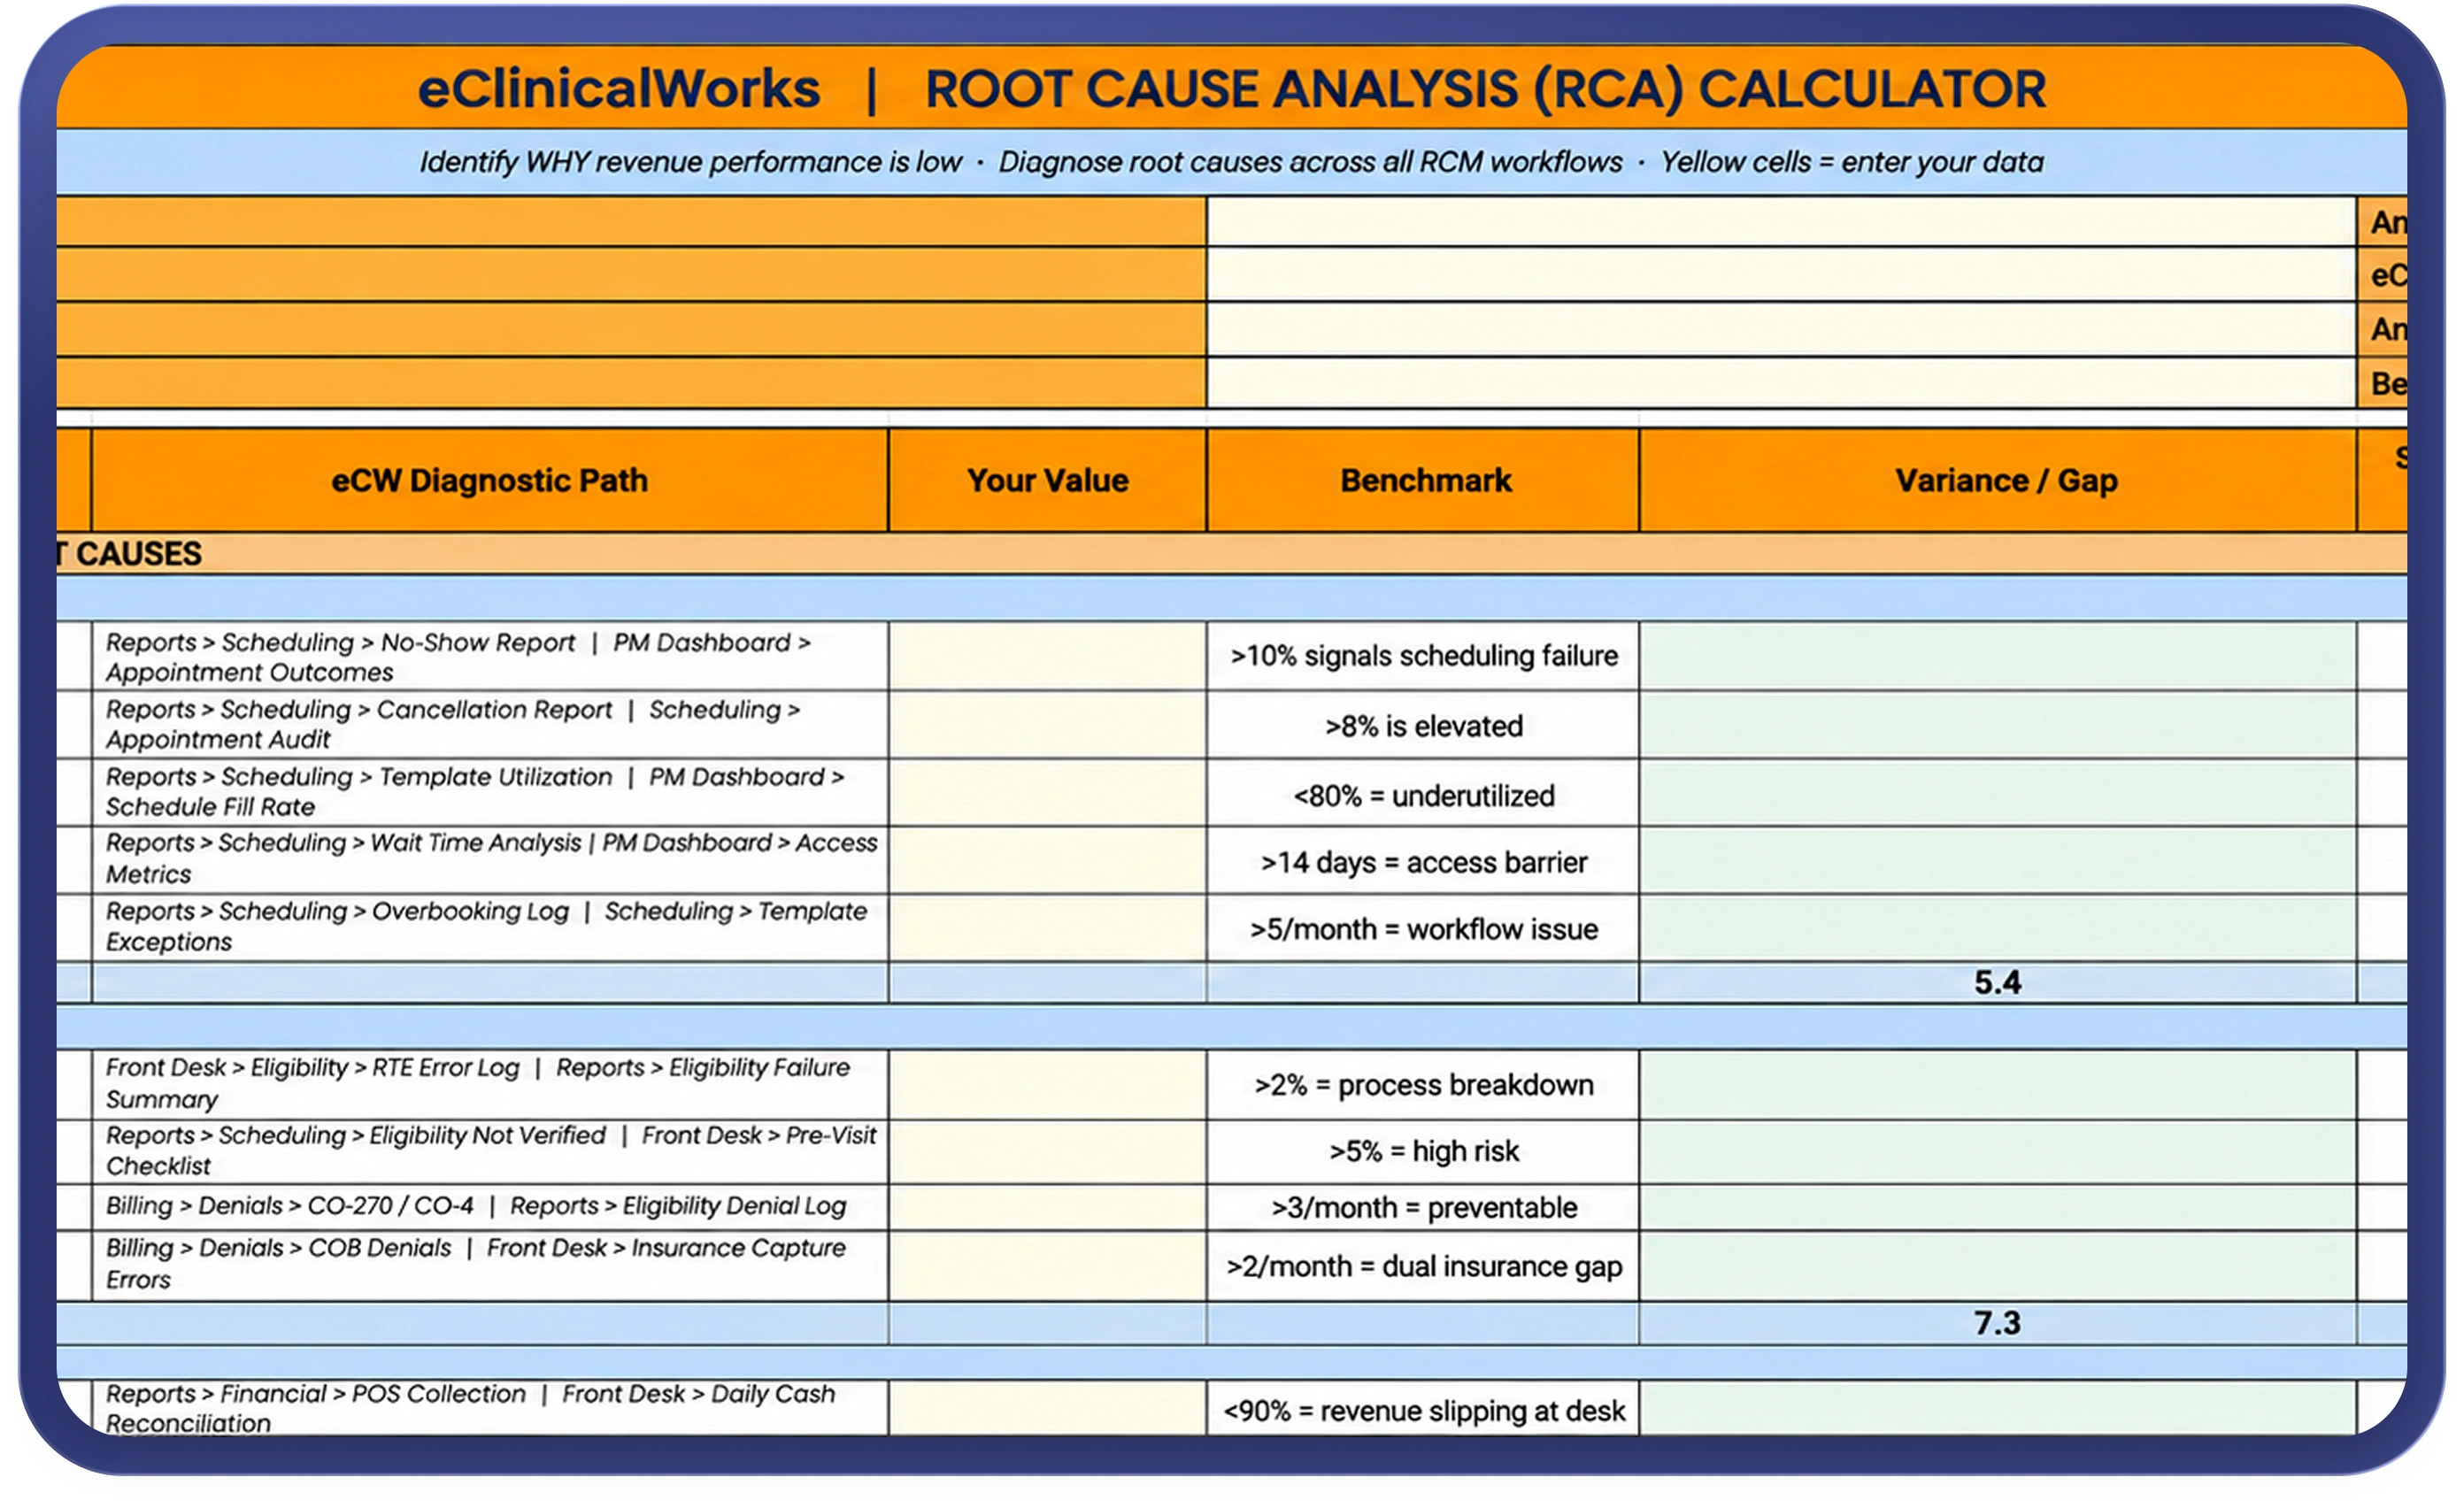
eClinicalWorks can show you that your clean claim rate dropped or your denials went up. It can't tell you whether that's because eligibility wasn't checked, a template wasn't configured, or a coder missed a modifier—three completely different fixes that all look the same from the outside.
This calculator scores every metric 1 to 10 for severity, flags it Critical, Moderate, or Monitor automatically, and ranks your worst sections first. Enter your monthly collections once, and it projects exactly how much each root cause area is likely costing you, in dollars, not just a severity score.
What's Inside This Calculator?
One workbook, two tabs: the scoring model itself, and a step-by-step guide to using it.
1. Front Desk, Clinical & Coding Root Causes
- Scheduling, eligibility checks, and point-of-service collections get scored where patient access breaks down first
- Unsigned encounters, missing diagnoses, and template usage cover the clinical documentation side
- CPT accuracy, E/M level distribution, and coder certification round out the coding root causes
- Every metric links to the exact eCW report path, no hunting through menus to find the number
2. Claims, Denials & Payment Root Causes
- Clean claim rate, submission lag, and superbill accuracy get scored where billing workflow slows down
- Denials break out by category—eligibility, authorization, coding, timely filing, medical necessity—not lumped into one number
- ERA posting accuracy and payer contract compliance cover what happens after the claim is paid
- Appeal rate and overturn rate get scored separately, since a high denial rate and a low appeal rate are two different problems
3. Collections, A/R & Operations Root Causes
- Patient statements, bad debt, and A/R aging get scored section by section instead of as one blended number
- Credentialing, provider enrollment, and eCW system configuration get the same severity treatment as clinical or billing gaps
- Staff training and process root causes get scored too, since a workflow gap is often a training gap first
- The priority matrix averages severity by section automatically and ranks your worst areas without any manual tallying
4. Revenue Impact & Action Plan
- Enter your monthly collections once, and the tool projects the dollar recovery potential for every root cause area
- A pre-built executive summary comes with 10 common findings and a 30-60-90 day action structure
- Every action gets an owner column, so a finding doesn't just sit in a spreadsheet
- Re-run it monthly or quarterly and watch severity scores drop as root causes actually get fixed
Built for Healthcare Leaders Responsible for Revenue Cycle Diagnosis
Built for the people who are tired of fixing the system and watching the same problem come back next quarter.


